Berkeley Lab

Computer Science Fills Groundwater Data Gaps and Advances Water Level Predictions

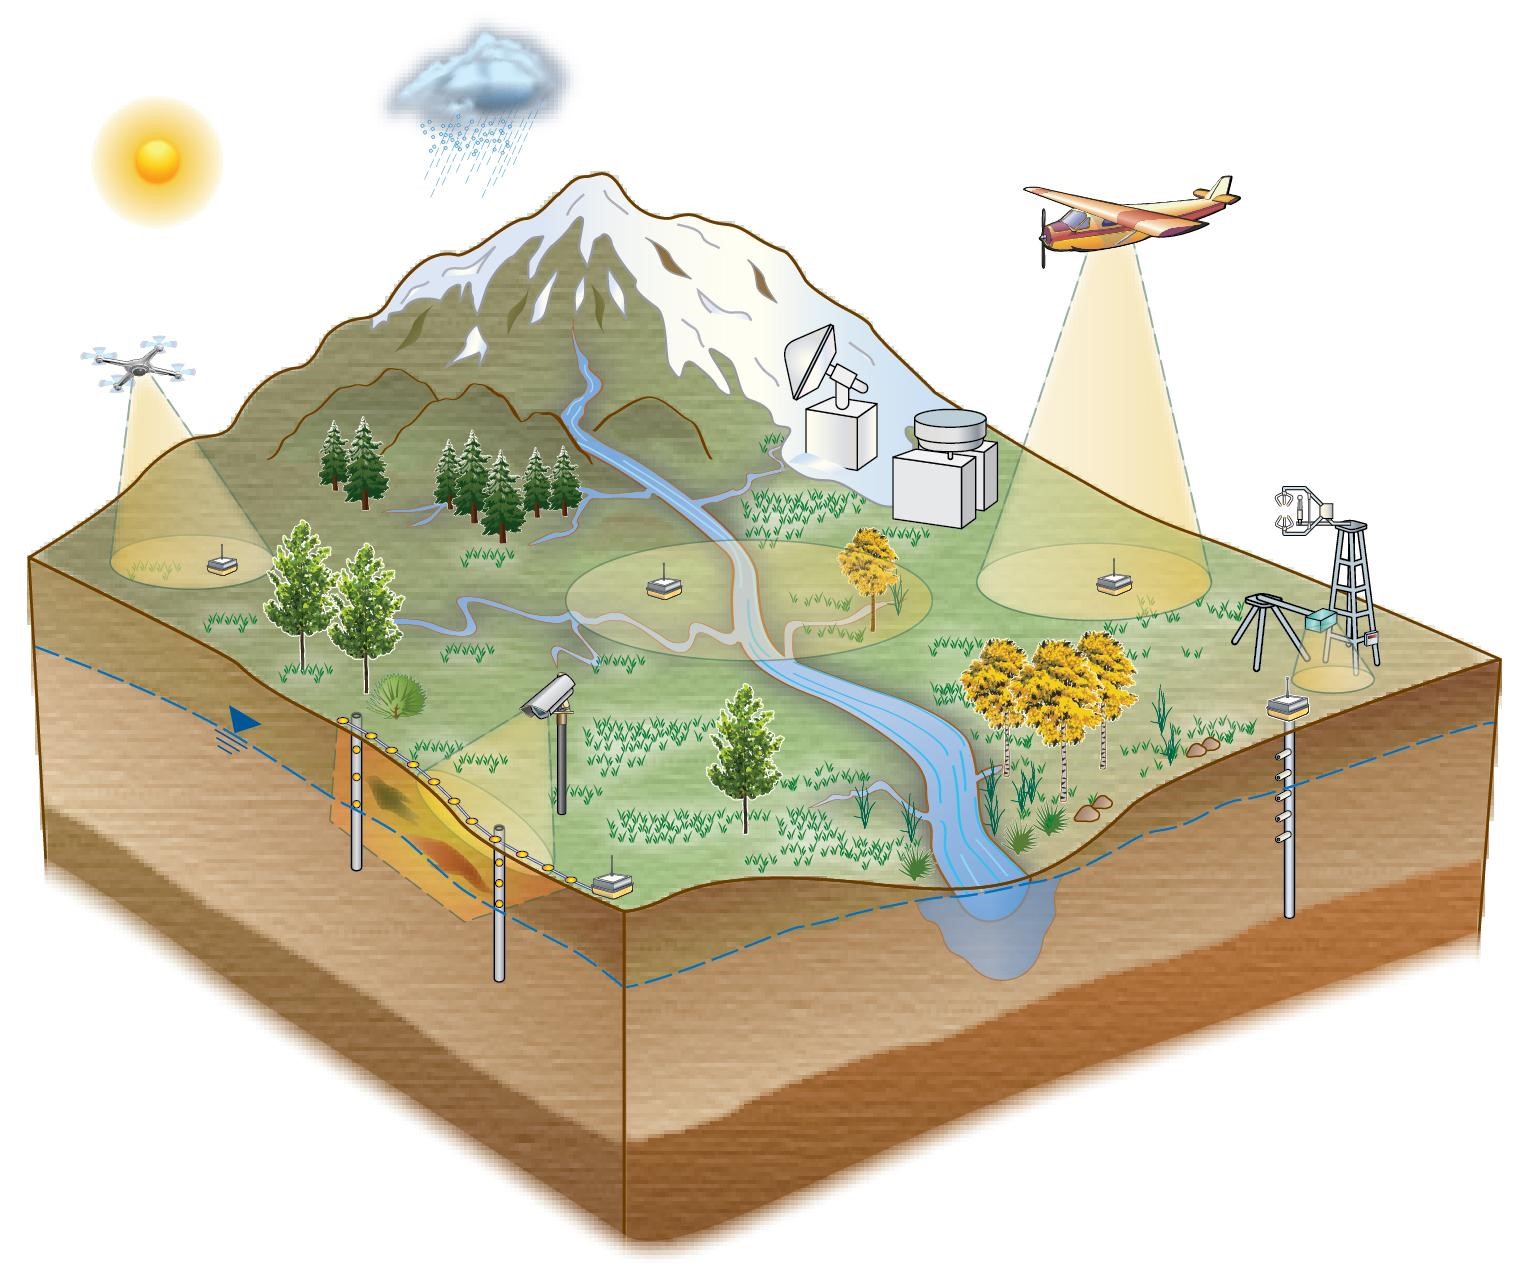
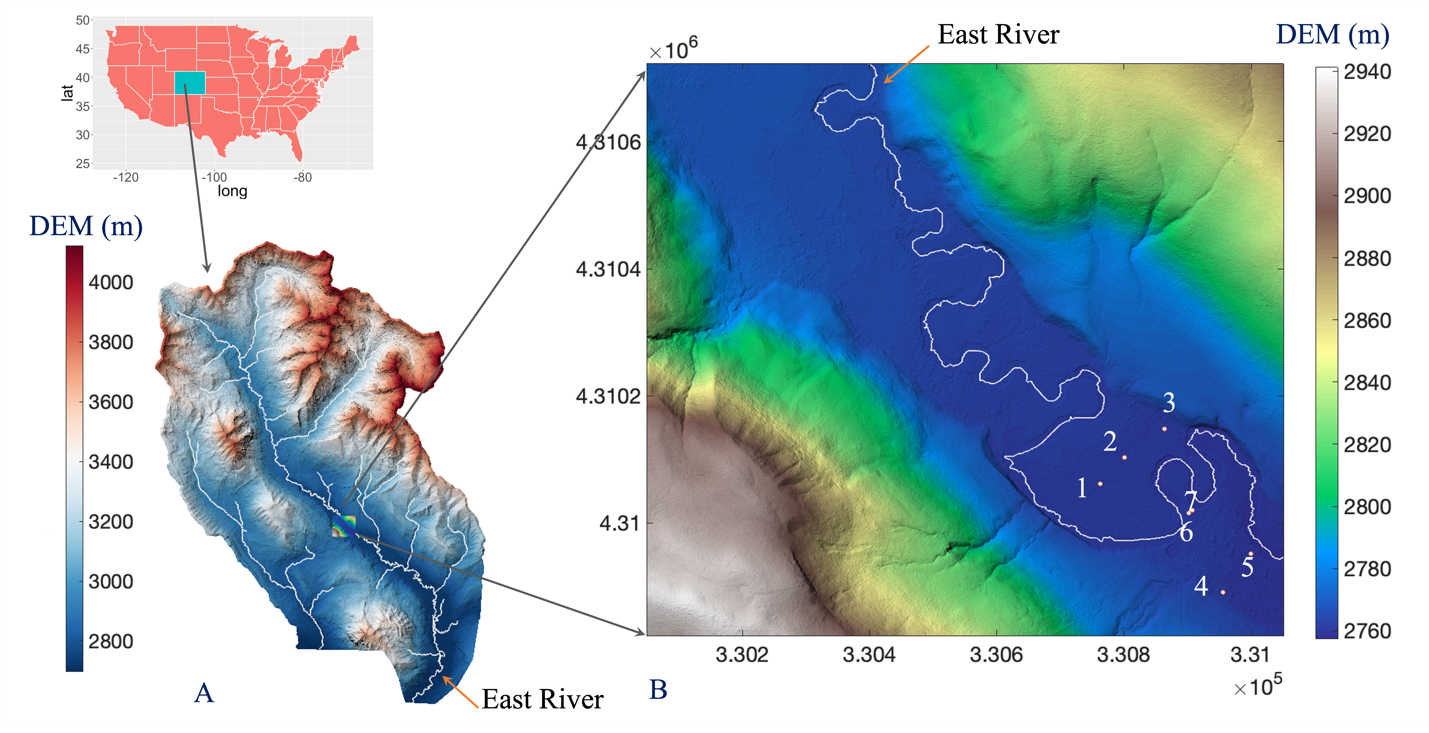
We develop an approach for estimating missing groundwater data at a study site located in the East River watershed, a high-elevation catchment in southwestern Colorado (a). Seven monitoring wells (WLE1 to WLE7, marked as 1 to 7) are located in the East River watershed floodplain (b).

The Science

Sixty to 90 percent of the world’s water comes from alpine watersheds, but without continuous data about characteristics like groundwater levels, temperature, and precipitation it can be nearly impossible for scientists to understand groundwater dynamics well enough to help predict the amount or quality of water coming from those mountains. Machine learning (ML)–using computer science to make predictions and inferences about data–can be used to help estimate missing data due to power outages, failures in the equipment used to gather the data, and extreme weather events from previous datasets gathered on these features. Researchers recently evaluated several ML-based techniques to infer data missing from datasets previously obtained at multiple wells in the East River Watershed located in southwestern Colorado. The team developed a new sequential approach to use existing data from previous time periods to estimate the missing extremes of a hydrograph, which shows the rate of water flow over time. This approach allows for missing groundwater data in the East River to be estimated with high accuracy.

The Impact

Environmental datasets such as groundwater data are often incomplete and contain missing entries due to various reasons such as adverse weather conditions or delays in collecting sensor data. Scientists rely on data about previous groundwater levels to predict the availability, quality, and function of freshwater. However, without continuous data sets, it is challenging to use scientific models that require this data to properly predict groundwater functioning. Researchers showed that ML techniques could be used to fill in gaps in these data series using previous data from a single well or data from surrounding wells. Overall, this new approach can be transferable to gap-fill other environmental datasets like precipitation and soil moisture. Complete groundwater and other environmental data are critical to monitor how freshwater and other natural resources may change as climate and environmental conditions change.

Summary

It is not uncommon for groundwater data series to have missing records due to factors like malfunctioning technology and physical disturbances. Researchers explored several techniques to gap-fill groundwater datasets, focusing on missing data patterns that are either random, such as data missing from one day in a series of several days, or contiguous gaps, such as a lack of data for an entire month during an observed time period. The researchers considered data from both single and multiple wells, looking to gap-fill missing groundwater entries in a well using that same well’s time-series data in the case of single wells, and for multiple wells using available data from neighboring wells to gap-fill a specific well’s missing groundwater data. They compared three machine-learning methods to understand which was better at estimating missing data for either the random or contiguous patterns. All three were shown to estimate up to 90% of random gaps in the groundwater time series over a two-year period. Multiple-well methods could effectively estimate up to 50% of missing contiguous gaps, but failed to capture extremes for the same period. The research team has developed an effective strategy to capture missing extremes in the groundwater time series and demonstrated its application across multiple wells in the Colorado East River floodplain.

Citation

Dwivedi, D., Mital, U., Faybishenko, B., Dafflon, B., Varadharajan, C., Agarwal, D., Williams, K H., Steefel, C. I. and Hubbard, S. S. Imputation of Contiguous Gaps and Extremes of Subhourly Groundwater Time Series Using Random Forests, Journal of Machine Learning for Modeling and Computing, Volume 3, 2022, Issue 2, DOI: 10.1615/JMachLearnModelComput.2021038774

Field-scale Estimation of Soil Properties from Spectral Induced Polarization Tomography

2D Estimates of cation exchange capacity, water content, grain size and permeability were obtained along a 45m ecosystem transect through development and demonstration of a field geophysical method called spectral induced polarization tomography. Image courtesy of the authors (A. Revil et al.)

The Science

Properties that influence how fluids flow and react in soils are difficult to measure using conventional techniques. This challenge stems from the time and cost involved to collect and analyze soil samples, and because collection of the soil samples can disturb the property of interest. This study describes how a surface geophysical approach, called spectral induced polarization tomography, can be used to estimate soil chemical and physical processes over field scales without disturbing the soil. The authors demonstrated the geophysical approach by collecting data along an ecosystem transect. Analysis of the data led to high-resolution estimates of important soil properties over the top 4 meters of soil along the transect, including cation exchange capacity, water content, grain size and permeability. Comparison of the obtained estimates with lab and soil core measurements indicated good agreement.

The Impact

This is the first ever field-scale estimation of soil hydrogeochemical properties using a geophysical approach called spectral induced polarization tomography. The ability to remotely quantify soil hydrological and geochemical properties in high resolution and over field-relevant scales, as demonstrated by this study, is expected to be useful for many applications, including watershed and ecosystem investigations, geotechnical engineering, and agriculture.

Summary

Estimates of soil properties such as Cation Exchange Capacity (CEC), water content, grain size and permeability are important in geotechnical engineering, water resources, and agriculture. We develop a non-intrusive approach to estimate these properties in the field using spectral induced polarization (SIP) tomography. This geophysical method provides information about the frequency dependence of the complex electrical conductivity of porous media. Using 18 soil samples collected from a managed ecosystem, we first conducted a laboratory study using SIP over the frequency range 10 mHz-45 kHz. The laboratory data were used to confirm the accuracy of a recently developed dynamic Stern layer petrophysical model. A comparison was made by comparing the field complex conductivity spectra and the experimental data at two locations where core samples were obtained. The model was then used in concert with field data to image the spatial distribution of CEC, water content, permeability, and mean grain size along a 2D transect. For clay and sandy textures found in the field, good agreement was found between measured and estimated CEC values. Our approach provides an efficient way to estimate important soil properties in a non-invasive manner, in high resolution, and over field-relevant scales of the critical zone of the Earth.

Citation

Revil, A., Schmutz, M., Abdulsamad, F., Balde, A., Beck, C., Ghorbani, A., Hubbard, S.S. (2021). Field-scale estimation of soil properties from spectral induced polarization tomography. Accepted in Geoderma. DOI: 10.1016/j.geoderma.2021.115380

What a Low-to-No-Snow Future Could Mean for the Western U.S.

The Science

Mountain snowpack acts as a large natural reservoir, providing water resources to communities, ecosystems, energy and industry upon spring snowmelt. Because up to 75% of western the region’s water resources originate in mountainous watersheds, decreasing snowpack threatens resiliency of the systems that depend on snowmelt water. This research synthesizes historical observations of western U.S. snow loss over the 20th century and develops a range of projected snowpack conditions in the 21st century. This study highlights that it is likely that western U.S. snowpack will decrease substantially over the next ~35-60 years, especially if high greenhouse gas emissions continue.

The Impact

Comparable to recent western snowpack declines, future snow losses are projected to decrease 20-30% by the 2050s and 40-60% by the 2100s. But there’s potential to build resilience to future low-to-no snow conditions using a portfolio of adaptation strategies. Models used to project future water cycle changes need to be improved to provide water resource managers with estimates that are better suited to decision making. The development of new atmosphere-through-bedrock modeling capabilities are needed, and could greatly benefit from non-traditional scientific-stakeholder partnerships.

Summary

This study synthesizes observational evidence of snow loss in the western U.S. over the 20th century and develops a range of projected snowpack conditions in the 21st century, elevating the understanding and importance of snow loss on water resources. Results show that there is less consensus on the time horizon of future snow disappearance, but that model projections suggest that if carbon emissions continue unabated, low-to-no snow conditions will become persistent in ~35–60 years, depending on the mountain range. We propose a new low-to-no snow definition which uses a percentile approach, akin to the U.S. Drought Monitor, and considers sequencing of 1, 5, or 10 low-to-no snow years via a framework describing those losses as “extreme, episodic, or persistent.” Potential trickle down impacts on mountain landscapes, hydrologic cycles, and subsequent water supply are also discussed. For example, diminished and more ephemeral snowpacks that melt earlier will alter groundwater and streamflow dynamics, but the direction of these changes are difficult to constrain given competing factors such as higher evapotranspiration, altered vegetation composition, and changes in wildfire behavior in a warmer world. A re-evaluation of long-standing hydroclimatic stationarity assumptions in WUS water management is urgently needed, given the impending impacts of snowpack loss. These hydroclimatic changes undermine conventional western U.S. water management practices, but through proactive implementation of soft and hard adaptation strategies, there is potential to build resilience to extreme, episodic and, eventually, persistent low-to-no snow conditions. Finally, suggestions are provided for the scientific breakthroughs, management strategies, and institutional partnerships that will be needed to overcome a future with less or no snow. Co-production of knowledge between scientists and water managers can help to ensure that scientific advances provide actionable insight and support adaptation decision-making processes that unfold in the context of significant uncertainties about future conditions.

Citation

Siirila-Woodburn, E.R*., A.M. Rhoades*, et al. “A low-to-no snow future and its impacts on water resources in the western United States” Nature Reviews Earth and Environment. (2021) [DOI: 10.1038/s43017-021-00219-y] Open access: https://rdcu.be/cAivm. *Equally contributing first-author.

A hybrid data-model approach to map soil thickness in mountain hillslopes

Soil thickness map. (a) The map of soil thickness from modeling. (b1) and (b2) Comparison between model and field measurements for the south-facing and north-facing hillslope, respectively. The error bars along the x-axis are the differences between auger and CPT data. Gray and green dots present the bottom of the sampling site is bedrock and saprolite, respectively.

The Science

Soil thickness plays a central role in the interactions between vegetation, soils, and topography where it controls the retention and release of water, carbon, nitrogen, and metals. However, mapping soil thickness—here defined as the mobile regolith layer—at high spatial resolution remains challenging. An accurate soil thickness map can improve the estimation of water, carbon, nitrogen, and other elements dynamics for hydrologic and biogeochemical modelling, but soil thickness remains one of the key uncertainties because of the complexity of factors that affect soil thickness.

The Impact

A new hybrid model combines a process-based model with empirical relationships to reveal the fundamental mechanisms of soil thickness and understand the spatial variability. This hybrid model generalizes the mechanisms and is therefore applicable to various sites. The soil thickness map can be an essential input for Earth System model, particularly for land surface models.

Summary

Here, the authors develop a hybrid model that combines a process-based model and empirical relationships to estimate the spatial heterogeneity of soil thickness with fine spatial resolution (0.5 m). The authors apply this model to two aspects of hillslopes (southwest- and northeast-facing, respectively) in the East River Watershed in Colorado. Two independent measurement methods—auger and cone penetrometer—are used to sample soil thickness at 78 locations to calibrate the local value of unconstrained parameters within the hybrid model. Sensitivity analysis using the hybrid model reveals that the diffusion coefficient used in hillslope diffusion modelling has the largest sensitivity among all input parameters. In addition, our results from both sampling and modeling show that, in general, the northeast-facing hillslope has a deeper soil layer than the southwest-facing hillslope. By comparing the soil thickness estimated between a machine learning approach and this hybrid model, the hybrid model provides higher accuracy and requires less sampling data. Modeling results further reveal that the southwest-facing hillslope has a slightly faster surface soil erosion rate and soil production rate than the northeast-facing hillslope, which suggests that the relatively less dense vegetation cover and drier surface soils on the southwest-facing slopes influence soil properties. With seven parameters in total for calibration, this hybrid model can provide a realistic soil thickness map with a relatively small amount of sampling dataset comparing to machine learning approach. Integrating process-based modeling and statistical analysis not only provides a thorough understanding of the fundamental mechanisms for soil thickness prediction, but integrates the strengths of both statistical approaches and process-based modeling approaches.

Citation

Yan, Q., Wainwright, H., Dafflon, B., Uhlemann, S., Steefel, C. I., Falco, N., Kwang, J., and Hubbard, S. S.: A hybrid data–model approach to map soil thickness in mountain hillslopes, Earth Surf. Dynam., 9, 1347–1361, https://doi.org/10.5194/esurf-9-1347-2021, 2021

Testing geological origins of fast groundwater pathways using machine learning

(a) Data from the East River valley, Colorado showing an anomaly – a geological feature that is different from its surroundings. A new machine learning method tests multiple interpretations of how this feature could have formed, demonstrating that one (b) is consistent with the measured data while the other (c) is not.
Image courtesy of Alex Miltenberger

The Science

Groundwater provides about a third of earth’s freshwater, yet much is still unknown about where and how water moves underground. Geological features affect groundwater movement, but these structures often can’t be seen from Earth’s surface. Understanding how these features may have formed can help enhance knowledge about the broader behavior and structure of watersheds, allowing for better predictions of freshwater movement. A team of scientists developed a method to map underground flow pathways and understand how they formed. The researchers used Bayesian hypothesis testing to compare multiple interpretations, or scenarios, for what created the flow pathways, such as from a crack in earth’s surface or rock-mass movements. Then, these interpretations are ranked by how consistent they are with the measured data using machine learning. This method was applied at a fractured bedrock zone – an area of cracked and crushed subsurface rock – in the Elk Mountains of Central Colorado, where water flows much faster through these fractures than in surrounding rock. The method demonstrated that the fractured bedrock was most likely created by a fault or sedimentary layer.

The Impact

Sustainable management of groundwater is becoming urgent as groundwater resources are increasingly withdrawn in response to population increase and climate change. Mapping groundwater flow pathways is crucial for understanding freshwater behavior and movement. This research shows that machine learning can help scientists understand how the geology of an area forms groundwater flow pathways, and can be applied to enhance freshwater resource management. In places affected by drought or contamination, knowing the path of groundwater flow can help conserve water or stop the spread of contaminants.

Summary

Certain structures in the Earth form groundwater “highways”, where water moves faster than normal. Finding these structures is crucial for understanding when and where groundwater moves. When flow pathways are hidden below the surface, they are found by sending electrical, magnetic, and other signals into the ground and measuring how the ground responds. Since different geological formations respond differently to the signals, we can use the signals to find places underground that are likely to contain groundwater flow pathways. However, multiple geological structures can have similar responses, which makes it hard to choose the best interpretation of how these structures could have formed. A team of scientists developed a method to test multiple interpretations of these types of signals.

The proposed method has three parts. First, for each proposed interpretation, the signals and measurements are simulated on a computer. Second, the researchers compare the simulated data to the field data for each interpretation. Finally, using machine learning the team ranks each interpretation according to how closely it matches data gathered in the field. The research team applied this method to a zone of fractured rock in the Elk Mountains of Central Colorado. Six interpretations are proposed and ranked according to how closely they match the measurements. The team concludes that the fractured rock is from either a fault or a sedimentary layer.

Citation

A. Miltenberger, et al. “Probabilistic Evaluation of Geoscientific Hypotheses with Geophysical Data: Application to Electrical Resistivity Imaging of a Fractured Bedrock Zone”. Journal of Geophysical Research: Solid Earth. 126, e2021JB021767 (2021). [DOI: 10.1029/2021JB021767]

State-of-the-Knowledge: Linking Hydrological and Biogeochemical Processes in Riparian Corridors

(A) The riparian corridors include various subsystems, such as hyporheic zones, meanders, wetlands, and lagoons, all of which impact river water quality (modified from Natural levees, Pearson Prentice Hall, Inc.). (B) A zoomed-in view highlights the importance of temporal dynamics within an intrameander region.

Rivers and adjacent landscapes are important parts of the Critical Zone. They serve as integrators of the hydrologic and biogeochemical cycles, constituting the primary pathways for geochemical exports from watersheds. Thus, they exert primary control on determining the downstream river water quality. The net geochemical export of metals and nutrients from watersheds depends strongly upon hydrological exchanges and biogeochemical transformations at the terrestrial–aquatic interfaces and riparian corridors. It is critical to link hydrological and biogeochemical processes in riparian corridors so as to understand how Critical Zone processes regulate future water quantity and quality for sustainable management. Here we invited theoretical and data-driven contributions that can advance the predictive understanding of riparian corridor processes.

Riparian corridors include various subsystems, such as hyporheic zones, meanders, wetlands, and lagoons, all of which impact river water quality. These subsystems demonstrate distinct biogeochemical potential depending upon their hydrologic connectivity to the main channel. However, several hurdles must be overcome to improve the predictive capability of riparian corridor processes across scales. This Research Topic aimed to enhance our understanding and predictive capability related to linked hydrological and biogeochemical processes in riparian corridors. We received contributions across a wide spectrum of topics, including hydrologic exchange and river connectivity as well as geochemical exports of carbon, nitrogen, colloids, and microbial dynamics. These topics also involved novel method development, new observational networks, advanced mechanistic modeling, and the use of artificial intelligence and machine learning approaches. Below, we briefly synthesize these contributions under two groups focused on dynamic hydrologic connectivity and microbial and physical controls on spatial patterns in river corridors.

Summary

Over the past several decades, the complexity of rivers and their adjacent environments and the important roles that they play in watershed function have been increasingly recognized. The large number of contributions to this Research Topic reflect continued high interest in understanding and quantifying the interactions between hydrological, microbial, and biogeochemical processes that underlie ecological health and water quality in these critical systems across spatiotemporal scales. It is particularly encouraging to see that hydrological connectivity has received considerable attention in this Research Topic to unravel the conundrum of high biogeochemical activity in riparian corridors. However, it is important to realize that there is no consensus about the definition of hydrological connectivity across fields. Further, we need to acknowledge the wide range of complexity of dynamic hydrological connectivity appropriately to enhance process understanding of riparian corridors. Finally, we expect that emerging technologies, radical collaboration, new constructs, and open science principles will keep transforming predictive capabilities of hydrobiogeochemical behavior of riparian corridors.

Citation

Dwivedi D, Godsey SE and Scheibe TD (2021) Editorial: Linking Hydrological and Biogeochemical Processes in Riparian Corridors. Front. Water 3:693763. doi: 10.3389/frwa.2021.693763

Hidden processes during seasonal isolation of a high-altitude watershed

Conceptual model of biogeochemical processes within the ER study site.

Our understanding of biogeochemical processes including surface-subsurface flux between the hyporheic zone and overlying water column is reduced where sample acquisition is difficult or impossible. Potentially deterministic changes to ecosystem function occur during such intervals, such as the onset of a seasonal change, over an extended quiescent period, or when extreme events (e.g., storms or rapid thaws) punctuate a temporal record. High-altitude locations, such as where headwater streams are often located, are archetypical in this regard as they may be difficult to reach under the best conditions and are nearly impossible to reach when events that are linked to seasonal inclemency restrict access or defy our ability to time data collection with episodic events. In these cases, our understanding of ecosystem function can come through approaches that employ continuous measurements.

This research defines how to address key data gaps in our current understanding of watershed biogeochemistry during seasonal inaccessibility. Continuous, autonomous sampling using the OsmoSampler produces reliable measurements of geochemistry and microbiology and may be applied in diverse environments to capture previously hidden biogeochemical processes where access is limited or impossible.

Summary

Biogeochemical processes capable of altering global carbon systems occur frequently in Earth’s Critical Zone–the area spanning from vegetation canopy to saturated bedrock– yet many of these phenomena are difficult to detect. Observation of these processes is limited by the seasonal inaccessibility of remote ecosystems, such as those in mountainous, snow- and ice-dominated areas. This isolation leads to a distinct gap in biogeochemical knowledge that ultimately affects the accuracy and confidence with which these ecosystems can be computationally modeled for the purpose of projecting change under different climate scenarios. To examine a high-altitude, headwater ecosystem’s role in methanogenesis, sulfate reduction, and groundwater- surface water exchange, water samples were continuously collected from the river and hyporheic zones (HZ) during winter isolation in the East River (ER), CO watershed. Measurements of continuously collected ER surface water revealed up to 50 μM levels of dissolved methane in July through September, while samples from 12 cm deep in the hyporheic zone at the same location showed a spring to early summer peak in methane with a strong biogenic signature (<65 μM, δ13C-CH4, −60.76‰) before declining. Continuously collected δ18O-H2O and δ2H-H2O isotopes from the water column exhibited similar patterns to discrete measurements, while samples 12 cm deep in the hyporheic zone experienced distinct fluctuations in δ18O-H2O, alluding to significant groundwater interactions. Continuously collected microbial communities in the river in the late fall and early winter revealed diverse populations that reflect the taxonomic composition of ecologically similar river systems, including taxa indicative of methane cycling in this system. These measurements captured several biogeochemical components of the high-altitude watershed in response to seasonality, strengthening our understanding of these systems during the winter months.

Citation

Buser-Young, J. Z., Lapham, L. L., Thurber, A. R., Williams, K. H. & Colwell, F. S. Hidden Processes During Seasonal Isolation of a High-Altitude Watershed. Front. Earth Sci. 9, (2021). https://doi.org/10.3389/feart.2021.666819

Meander-bound Floodplains as a Scaling Motif for understanding how the Soil Microbiome influence Watershed Biogeochemical Cycles

Taxa detected across samples (a). A core floodplain microbiome includes abundant Betaproteobacteria (b), and 42 genomes (c; teal) present in > 89 samples with a low coefficient of variation of abundance (d), not associated with any given floodplain (e; brown).

We studied the most abundant microorganisms (microbiome) in 130 topsoil samples from three meander-bound floodplains along the East River, CO during a period of low river flow and over two consecutive years. We reconstructed 248 draft quality genomes (at the sub-species level) from these samples. DNA (metagenomes) and RNA (metatranscriptome) sequences revealed the presence of bacteria that are commonly found across the floodplains over time. Despite the very high microbial diversity and complexity of the soils, ~15% of species were detected in two consecutive years, and approximately one third of the representative genomes were detected with similar levels of abundance across all three locations. The capacities for aerobic respiration, aerobic CO oxidation (and other small molecules), and thiosulfate oxidation were enriched in these microorganisms. However, the most active genes at the time of sampling were involved in nitrification, methanol and formate oxidation, and nitrogen and CO2 fixation. Our results highlight the prominence of sulfur, nitrogen, and one-carbon metabolism in the watershed.

We were able to reconstruct hundreds of microbial genomes from complex soil samples. We found that soils bounded by individual river meanders capture processes that occur in soils bounded by other meanders along the river corridor. This is important, given that there is a need to understand microbially-mediated biogeochemical transformations, which occur at the millionth of a meter scale, at the tens to hundreds of kilometer scale of watershed ecosystems. The presence of the same bacteria (~ 15%) over two consecutive years, combined with differences between common capacities and important capacities at the time of sampling, suggests that the floodplain soil microbiome is versatile and can respond to natural disturbances (e.g., flooding resulting from spring snowmelt).

Summary

Meander-bound floodplains appear to serve as scaling motifs that predict aggregate capacities for biogeochemical transformations in floodplain soils. We identified a core floodplain microbiome that was consistent across floodplains and that was enriched in capacities for aerobic respiration, aerobic CO (and other small molecules) oxidation, and thiosulfate oxidation with the formation of elemental sulfur. Systematic patterns of gene abundance based on sampling position relative to the river were not detected. The most highly transcribed genes in the middle floodplain were amoCAB and nxrAB (for nitrification) followed by genes involved in methanol and formate oxidation, and nitrogen and CO2 fixation. Additionally, low soil organic carbon correlated with high activity of genes involved in methanol, formate, sulfide, hydrogen, and ammonia oxidation, nitrite oxidoreduction, and nitrate and nitrite reduction. While widely represented genetic capacities did not predict in situ activity at one time point, they defined a reservoir of biogeochemical potential available as conditions change and suggests the value of meanders as a scaling motif to improve prediction of watershed biogeochemistry.

Citation

Matheus Carnevali, P.B., Lavy, A., Thomas, A.D. et al. Meanders as a scaling motif for understanding of floodplain soil microbiome and biogeochemical potential at the watershed scale. Microbiome 9, 121 (2021). https://doi.org/10.1186/s40168-020-00957-z

The Colorado East River Community Observatory Data Collection

A visual representation of the diverse infrastructure and heterogeneous data collection activities at the East River Watershed. Figure from Kakalia et al. (2021)

The Science

The U.S. Department of Energy’s East River Community Observatory located in the East River watershed, Colorado, USA is a representative mountainous, snow-dominated system containing a diverse collection of sensors, water quality stations, experimental plots, and sample collection sites paired with remote sensing measurements and modeling activities. Data generated at the site are used to examine watershed system behavior and the impact of environmental perturbations, such as drought and early snowmelt, and are broadly relevant to the study of mountainous systems worldwide. Over 70 datasets are presently publicly available from multiple data repositories, with all having an open data policy.

The Impact

Hydro-biogeochemical data generated at the East River watershed are made publicly available for use by the global scientific community, allowing for collaboration across institutions and Federal and State Agencies. The co-located, interdisciplinary data collected at the East River watershed provide a comprehensive view of the environmental processes underlying watershed system function. Data types can be combined to find correlations between hydrological, biological, and chemical processes, with subsequent data analyses used to advance a predictive understanding of water quality and quantity in mountainous regions across the United States.

Summary

Research conducted at the East River (ER) watershed is broadly representative of mountainous headwater systems given the diversity of environmental gradients encompassed by its four principle drainages: East River, Washington Gulch, Slate River, and Coal Creek. The ER has both long-term and spatially-extensive observations and experimental campaigns carried out by the Watershed Function Scientific Focus Area (SFA) and researchers from over 30 organizations who conduct cross-disciplinary, process-based investigations and modeling of watershed system function. Collectively, the SFA and its collaborators generate diverse datasets including hydrological, (bio)geochemical, climate, vegetation, geophysical, microbiological, and remote sensing data. Additionally, predictive modeling datasets, including inputs, outputs and preprocessing codes are generated from numerical simulations of different watershed subsystems and their aggregated behavior. This paper highlights the acquisition and management of these diverse data products and describes where 71 public datasets can be accessed.

Citation

Kakalia, Z., Varadharajan, C., Alper, E., Brodie, E. L., Burrus, M., Carroll, R. W. H., Christianson, D. S., Dong, W., Hendrix, V. C., Henderson, M., Hubbard, S. S., Johnson, D., Versteeg, R., Williams, K. H., & Agarwal, D. A. (2021). The Colorado East River Community Observatory Data Collection. Hydrological Processes, 35(6), e14243. https://doi.org/10.1002/hyp.14243

Impact of agricultural managed aquifer recharge practices on groundwater quality

Denitrification rates under different stratigraphic configurations and AgMAR management scenarios – S1: All-at-once application (68 cm; once over 4 weeks); S2: Incremental application (17cm; 1x per week); and S3: Incremental application (17cm; 2x per week)

This is the first-of-its-kind study to quantify how legacy nitrogen in agricultural environments responds to changing hydrologic application rates and frequencies under AgMAR.

Scientists, engineers and practitioners seeking to apply AgMAR will find a description of water quality response under different stratigraphic configurations, antecedent moisture conditions and depth to water table.

Summary

AgMAR is a promising management strategy wherein surface waters are used to intentionally flood agricultural lands with the purposes of recharging underlying groundwater. However, it is not yet clear how legacy nitrogen that has been built up over the years from fertilizer use in these settings may respond to AgMAR practices, and more importantly, if flooding agricultural sites will enhance nitrate transport to the groundwater or attenuate it by supporting in situ denitrification. This study therefore uses a mechanistic model to evaluate the effects of different AgMAR management strategies (i.e., by varying the frequency, duration between flooding events, and amount of water) on nitrate leaching to groundwater under commonly-observed stratigraphic configurations in agricultural settings. Simulation results indicate that AgMAR is preferable where finer textured sediments exist that act as permanent sinks of nitrate via denitrification. Further, in comparing AgMAR strategies, our results indicate that applying same amount of recharge water all-at-once is desirable than smaller, incremental application but only under specific circumstances (e.g., lower antecedent soil moisture, lack of preferential flow paths). Our study concludes that ideal AgMAR recharge rates can be designed that honor groundwater quality with respect to nitrate, but need to account for underlying stratigraphy, antecedent moisture conditions and depth to water table.

Citation

Waterhouse, H., Arora, B., Spycher, N.F., Nico, P.S., Ulrich, C., Dahlke, H.E. and Horwath, W.R., 2021. Influence of Agricultural Managed Aquifer Recharge (AgMAR) and Stratigraphic Heterogeneities on Nitrate Reduction in the Deep Subsurface. Water Resources Research, DOI: 10.1029/2020WR029148.