Berkeley Lab

Blog: If You Have Sore Legs, Is It a Mountain?

christianericnellheidi-300x225
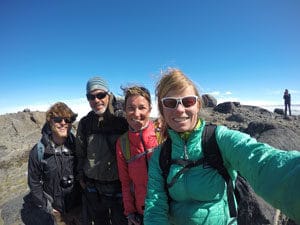
Image: Christian John, Eric Post, Nell Hermann, and Heidi Steltzer, July 2016, Greenland Ice Sheet

This summer, Heidi Steltzer worked in Greenland with an Arctic colleague, Eric Post, at his long-term study site, providing him with a ‘mountain’ perspective on the landscape and discussing its similarities to those the WF SFA studies in Colorado. Read her blog here.

Vadose zone respiration contributes significantly to CO2 fluxes

VZ-profiles-instrumentation-and-respiration-profiles

First column: Rifle (Colorado) floodplain vadose zone profile.
Second column: Instrumentation for monitoring pore water and gas profiles down to 3.5 m depth.
Third column: Respiration profiles are sustained by organic carbon carried in infiltration water.

In this SFA study (Tokunaga et al., Vadose Zone Journal), vertical profiles of carbon dioxide concentrations in pore gases, measured from the soil surface down to the water table in a semi-arid floodplain, were shown to have significant contributions from microbial respiration in the deeper vadose zone, well below the rooting depth and above the water table. Approximately 17% of the surface CO2 flux originates from depths between 2.0 and 3.5 meters. Respiration in the vadose zone and low net infiltration limit organic carbon transport to the aquifer. These contributions are not typically accounted for in Earth System Models (ESMs).

Summary

Although CO2 fluxes from soils are often assumed to originate within shallow soil horizons (< 1 m depth), relatively little is known about respiration rates at greater depths. The authors compared measured and calculated CO2 fluxes at the Rifle floodplain along the Colorado River, and measured CO2 production rates of floodplain sediments in order to determine the relative importance of vadose zone respiration. Calculations based on measured CO2 gradients and estimated effective diffusion coefficients yielded fluxes that are generally consistent with measurements obtained at the soil surface (326 g C m-2 yr-1). CO2 production from the 2.0 to 3.5 m depth interval was calculated to contribute 17% of the total floodplain respiration, with rates that were larger than some parts of the shallower vadose zone and underlying aquifer. Microbial respiration rates determined from laboratory incubation tests of the sediments support this conclusion. The deeper unsaturated zone typically maintains intermediate water and air saturations, lacks extreme temperatures and salinities, and is annually resupplied with organic carbon from snowmelt-driven recharge and by water table decline. This combination of favorable conditions supports deeper unsaturated zone microbial respiration throughout the year.

Benchmarking Reactive Transport Codes forSubsurface Environmental Problems

Top: Benchmarking activities can be defined based on how they are used – (A) to identify needs for further Improvement; (B) for standardized references.
Bottom: Differences in compaction schemes for two reactive transport models ToughReact and CrunchFlow.

Scientific Achievement

We present a comprehensive mathematical description of multi-component, multi-phase, flow and reactive transport processes at the continuum-scale as well as various constitutive relationships to parameterize the heterogeneous subsurface system under variably saturated conditions.

Significance and Impact

There is a growing need to benchmark reactive transport codes. The geosciences community has made significant efforts to benchmark reactive transport codes. A summary of such efforts is presented here.

Research Details
  • Provided a description of governing equations, numerical schemes including coupling and solution approaches
  • Included a thorough literature review on the benchmarking needs for developing standardized references, codes, models, conceptual model comparisons, performance and reliability
  • Described benchmarking activities initiated within the last several years by the geosciences community, including the SSBench initiative
Citation

Dwivedi, D., B. Arora, S. Molins, and C.I. Steefel (2016). Benchmarking reactive transport codes for subsurface environmental problems. In Groundwater Assessment, Modeling, and Management, ed. D. Thangarajan and V.P. Singh, 299–316. Boca Raton, Florida: McGraw-Hill.

Quantifying Shallow Subsurface Water and Heat Dynamics using Coupled Hydrological-Thermal-Geophysical Inversion

Flowchart showing the steps involved in the coupled hydrological-thermal-geophysical inversion scheme. Data for inversion in this study include matric potential, subsurface temperature and apparent resistivity

Scientific Achievement

The approach developed in this study is expected to be especially useful for an increasing number of studies that are taking advantage of autonomously collected soil electrical resistivity, moisture and temperature data to explore complex terrestrial system dynamics

Significance and Impact

The inversion scheme provides the desired subsurface property estimates in high spatiotemporal resolution. A particularly novel aspect of the inversion scheme is the explicit incorporation of the dependence of the subsurface electrical resistivity on both moisture and temperature.

Research Details
  • Consider the non-isothermal behaviour of the shallow subsurface as well as multiphase of moisture
  • Show that water infiltration in the top 50 cm does not occur every year due to high evaporation rate
  • Demonstrate the importance of considering subsurface temperature variability and its direct and indirect influence on the electrical resistivity
Citation

Tran, A. P.; Dafflon, B.; Hubbard, S. S.; Kowalsky, M. B.; Long, P.; Tokunaga, T. K.; Williams, K. H. (2016), Quantifying shallow subsurface water and heat dynamics using coupled hydrological-thermal-geophysical inversion, Hydrology and Earth System Sciences, 20(8), 3477-3491, DOI: 10.5194/hess-20-3477-2016.

Spatial Analysis and Geostatistical Methods

Rows 1-2 rows: Synthetic random field with different covariance functions and scales.
Row 3: Two equally likely randomly generated fields in the same parameter as in Row 4. the spectral method was used.

Scientific Achievement

We present a comprehensive description of spatial analysis and geostatistics as a set of numerical techniques to characterize spatial attributes and tackle next-generation research challenges in socio-hydrologic fields.

Significance and Impact

This chapter appears in the Handbook of Applied Hydrology, which is the next version of the classic Handbook of Applied Hydrology, edited by Professor V.T. Chow, almost 50 years ago. A summary of various spatial and temporal data types and their analyses using several techniques is provided.

Research Details
  • Described various data types and methods, including data mining techniques such as cluster analysis, wavelet analysis
  • Presented how to infer and represent structural information of heterogeneous model or data using heterogeneous field estimation and simulation, kriging and co-kriging, Gaussian field simulation, facies-based simulation, simulated annealing, etc.
  • Discussed estimating geostatistical parameters using a multi-physics joint inversion approach
Citation

Dwivedi, D., B. Dafflon, B. Arora, H.M. Wainwright, and S. Finsterle (2016). Chapter 21: Spatial Analysis and Geostatistical Techniques, in Handbook of Applied Hydrology, V. P. Singh (ed.). McGraw-Hill, SBN-13: 978-0071835091.

Blog: Not as Planned – First Five Weeks at RMBL

vole-chewed-cables-225x300
Image: Vole-chewed cables

In her blog, Heidi Steltzer chronicles the (unexpected) challenges faced in the first five weeks of her 2016 summer field season. Read the full story here.

On the capillary pressure function in porous media based on relative permeabilities of two immiscible fluids: Application of capillary bundle models

Top: Relative permeability curves for wetting (solid line) and nonwetting (dashed line) phases in the sand sample.
Bottom: Calculated specific surface area vs. normalized wetting-phase saturation calculated from the experimental data for the single and dual bundle capillaries models.

Scientific Achievement

Extended the theoretical approach and an analytical solution for the evaluation of a capillary pressure (Pc) curve in porous media based on the apparent specific surface area, using an explicit combination of the relative permeability functions for the wetting and nonwetting phases along with an equation for the apparent specific surface area and an apparent contact angle

Significance and Impact

It is shown that the relative permeability functions for the wetting and nonwetting phases can be used to implicitly take into account the geometry (topology), roughness and crevices of the heterogeneous porous medium, as well as obtain singularities at the residual points, which are difficult to obtain experimentally.

Research Details

The application of the capillary bundle models was applied to:

  • Revise the results of calculations of the effective contact angles based on published Pc and relative permeability curves, and
  • Validate the application of the capillary bundle models, using the results of the experimental study.
Citation

Babchin, A.J.; Bentsen, R.; Faybishenko, B.; Geilikman, M. B. (2016), On the capillary pressure function in porous media based on relative permeabilities of two immiscible fluids: Application of capillary bundle models and validation using experimental data, Advances in Colloid and Interface Science, 233, 176-185 DOI: 10.1016/j.cis.2015.07.001.

Two CESD Directors Visit East River

Dr. Gary Geernaert (Director of Climate & Environmental Sciences Division, DOE-BER) and Dr. Bill Collins (Director of Climate & Ecosystem Sciences Division, Berkeley Lab) joined Dr. Kenneth H. Williams for a tour of Berkeley Lab’s Watershed Function Science Focus Area (SFA) East River field site near Crested Butte, Colorado on July 28-29, 2016.

The tour gave both directors an opportunity 1) to assess the growing DOE and EESA research footprint at the field site, including visits to both active and planned SFA study plots; 2) to assess available infrastructure, including that supported by the Rocky Mountain Biological Laboratory; and 3) to meet local stakeholders in the areas of water availability and water quality. Also joining the tour were Dr. Reed Maxwell (Colorado School of Mines) and Dr. Lindsay Bearup (Berkeley Lab) who described hydrological modeling activities ongoing at the field site and their relevance to broader DOE and Berkeley Lab mission areas in hydroclimate research.

Left to Right: Reed Maxwell, Gary Geernaert, Bill Collins, Ken Williams

Left to Right: Reed Maxwell, Gary Geernaert, Bill Collins, Ken Williams

Innovative Geophysical Approach for Mapping Biogeochemical Hotspots in Floodplains

The new method (Wainwright et al., Water Resources Research) can be used to map biogeochemical hotspots in a spatially extensive and non-invasive manner, and is particularly useful for developing and parameterizing 3D biogeochemical models. Being able to map such hotspots will enable scientists to quantify the impact of floodplain subsurface processes on biogeochemical cycling through the terrestrial system and associated water quality exports to rivers.

3D estimation of subsurface geological layers

A three-dimensional estimation of subsurface geological layers (green and purple layers) and the naturally reduced zones (red) obtained using the new method at the Rifle Colorado study site. The region shown is the modeling domain, and the estimates obtained were used to parameterize a reactive transport model.

Summary

In floodplain environments, naturally reduced zones (NRZ) are considered to be common biogeochemical hotspots that have distinct microbial and geochemical characteristics. Although important for understanding their role in mediating floodplain biogeochemical processes, mapping the subsurface distribution of NRZs over the dimensions of a floodplain or larger is challenging, as conventional wellbore data are typically spatially limited and the distribution of NRZs is heterogeneous. In this study, the authors present an innovative methodology for the probabilistic mapping of NRZs within a three-dimensional (3D) subsurface domain using induced polarization imaging, which is a non-invasive geophysical technique. Measurements consisted of surface geophysical surveys and drilling-recovered sediments, both acquired at the U.S. Department of Energy field site near Rifle, CO. Inversion of surface time-domain induced polarization (TDIP) data yielded 3D images of the complex electrical resistivity, in terms of magnitude and phase, which are associated with mineral precipitation and other lithological properties. To estimate the spatial distribution of NRZs, the team developed a Bayesian hierarchical model to integrate the geophysical and wellbore data. Results showed that the integration of geophysical imaging and wellbore data using this proposed approach was capable of mapping spatially heterogeneous interfaces and NRZ distributions. As described by a follow-on paper, the geophysical estimates were subsequently used to parameterize a reactive transport model, to predict floodplain biogeochemical cycles and river export.

SFA Team Members Get UAS-Certified

uav-instruction

Matt explaining the operation of the DJI Phantom 2.

Six LBL researchers—including 4 Watershed Function SFA team members—traveled to Idaho National Laboratory (INL) to take an Unmanned Aircraft System (UAS) training.

The training course included a classroom briefing and hands-on pilot experience. Course instructor Matt Balderree offered thorough responses to attendee questions, and encouraged teamwork among participants—something which is crucial while conducting UAS operations in the field for reasons of safety, mitigating damage to equipment, and ensuring accurate collection of data.

The final test for pilot proficiency involved doing 2 figure 8’s around two pylons within a virtual rectangular box (10 x 40 meters). The test had to be completed within 2 minutes while maintaining heading in direction of travel.

Congratulations to Sebastien Biraud, Stephen Chan, Baptiste Dafflon, Emmanuel Leger, John Peterson, Craig Ulrich on successfully achieving pilot proficiency! Phil Long, also in attendance, was trained as a UAS observer.

baptiste_test-flight

Baptiste Dafflon starting his final flight test! John Peterson is his observer. Matt is checking to make sure his flight path meets the test requirements.