
Satellite images and computer simulations can guide watershed monitoring and generate hypotheses
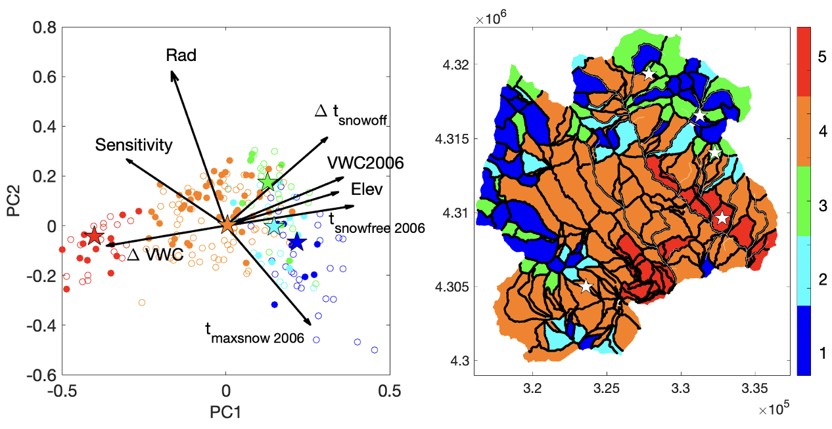
(left) Variability of watershed drought sensitivity (Sensitivity), annual potential radiation (Rad), snowmelt timing variability (Δtsnowoff), soil moisture variability (ΔVWC) and elevation (Elev). (right) Map of watershed that is separated with respect to these co-varied features. The circles represent all the hillslopes, while the filled circles are the ones with trail/road access. In (b), the five different colors represent different zones. In (a) and (b), the stars represent the most representative hillslopes in each zone with road/trail access.
The Science
Hydrological simulations and machine learning (ML) approaches provide a systematic approach to guide the placement of watershed monitoring locations, characterization, and experimental research, so that disturbances associated with climate change, such as droughts, can be monitored to determine their impact on downstream water availability and quality. Advanced computational technology has the potential to enable scientists to answer complex questions, such as the best locations where sensors and experimental plots should be placed, or how representative a particular location might be of an entire watershed.
The Impact
A multi-institutional team of scientists developed a new machine learning (ML)-based approach that provides a systematic way to combine results from watershed simulations to help scientists study watershed disturbances in addition to other key environmental factors like snowmelt and soil moisture variability. The approach involves grouping watershed areas with similar environmental characteristics to identify and map zones that capture bedrock-to-canopy properties, which can help scientists identify the most representative hillslopes. This approach highlights the power of ML to extract critical information from multiple types of watershed data, including both simulation and satellite products, leading to more accurate model-guided monitoring design and hypothesis generation.
Summary
To optimize the selection of sites that are most representative of specific factors or conditions for a watershed, a multi-institutional research team developed a systematic method using Machine Learning (ML) that combines simulation and satellite data to identify the most appropriate monitoring locations in a given watershed. The team applied the ML approach to study interactions among snow, soil, and plants, using data from the East River watershed in Colorado. The results showed that drought sensitivity is significantly correlated with model-derived soil moisture and snowmelt over space and time. The approach was also able to identify the locations of the watershed with high or low sensitivity to drought in addition to the most representative locations in the watershed accessible by trail or road in each of these areas. These findings can help scientists select locations most suitable for monitoring specific to the watershed characteristics they want to study.
Contact
Haruko Wainwright
Massachusetts Institute of Technology
hmwainw@mit.edu
Eoin L. Brodie, Watershed Function SFA LRM
Lawrence Berkeley National Laboratory
Funding
This material is based upon work supported as part of the Watershed Function Scientific Focus Area funded by the U.S. Department of Energy, Office of Science, Office of Biological and Environmental Research.
Publications
Wainwright, H. M., Dafflon, B., Siirila-Woodburn, E. R., Falco, N., Wu, Y., Breckheimer, I., & Carroll, R. W. (2024). Model and remote-sensing-guided experimental design and hypothesis generation for monitoring snow-soil–plant interactions. Frontiers in Water, 5, 1220146. https://www.frontiersin.org/journals/water/articles/10.3389/frwa.2023.1220146/full